We're linking research with practice.
At The Link, we share essential insights from different areas of research to support the growing community of those interested in scicomm.
We bring research to life to help you make an impact.
Connecting Science Communication Research with Action
Below is a curated selection of features from the field of science communication written by collaborators.

The Benefits and Burdens of Bar Graphs
There's no denying bar graphs are beneficial, but there are better ways to present your data.

Painting a Scicomm Picture of Your Research
Creating a visual to explain a scientific concept can be scary. But it doesn't have to be.


The Best Ways to Produce Effective and Appealing Data Visualizations
Nicolás Wiggenhauser presents five properties that will change the way you can visually tell stories with data.
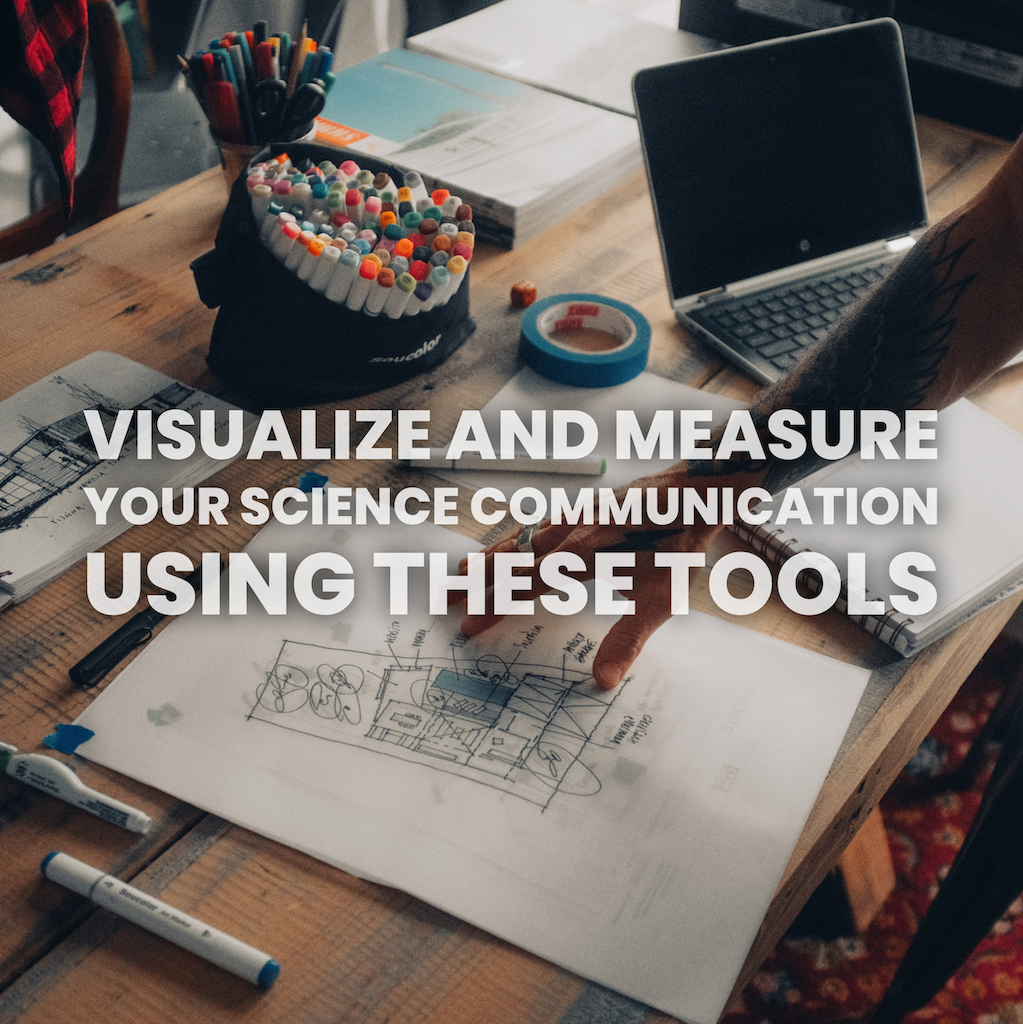
Visualize and Measure Your Science Communication Using These Tools
Engaging visuals help effectively communicate science. Learn more about the online tools that can help, without compromising the factuality of your science.
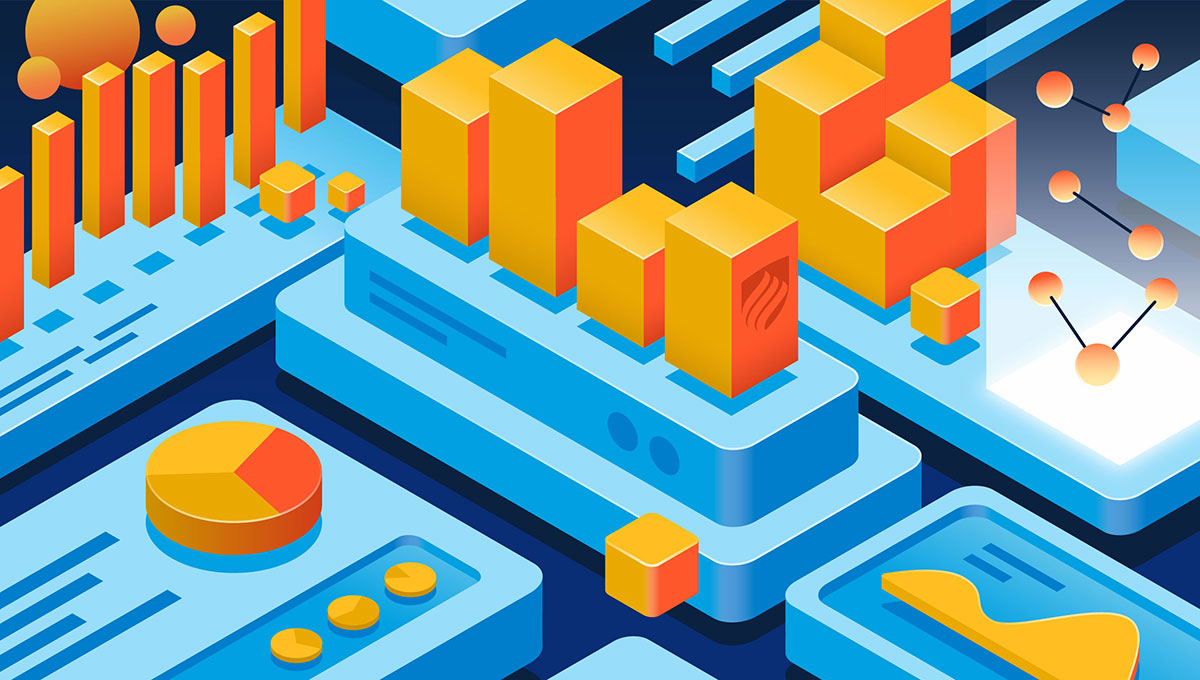
Storytelling with Data
Data visualization enables analysts and organizations to see huge quantities of data clearly and identify patterns quickly. However, in today’s world, where data is overwhelming, creating and communicating through compelling data visualizations...